
Team Activity Dashboard and Reports
The Team Activities feature allows Administrators and Case Design Managers to quickly see what their team is doing in the system. It gives you a clear view of activity such as clients created, quotes run, PDF reports generated, and when users were last active.
How to Access
Once you log in, you’ll land on your Dashboard this is your main workspace.
- If you’re on desktop, you’ll see the blue menu across the top
- If you’re on a smaller screen, you’ll use the hamburger menu (☰)
- Both menus take you to the same place it’s just a different layout depending on your device
From there, you have two simple ways to get to Team Activities:
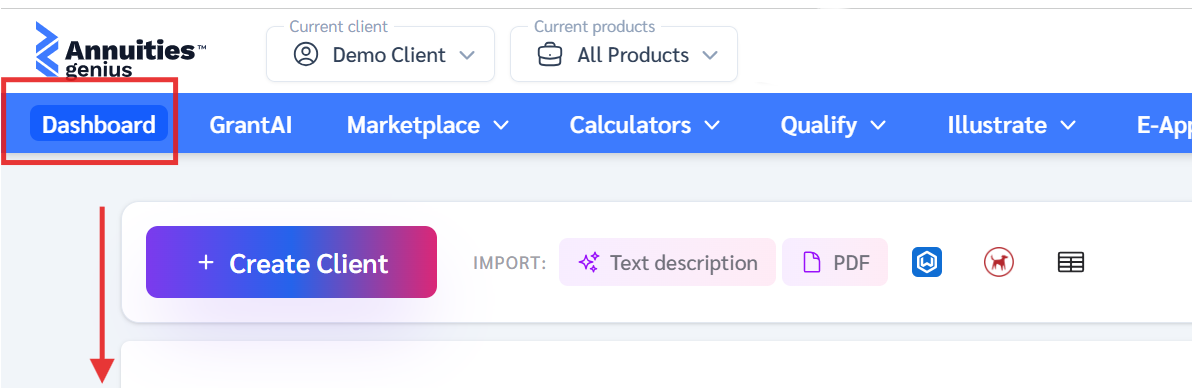
Option 1 — From your Dashboard
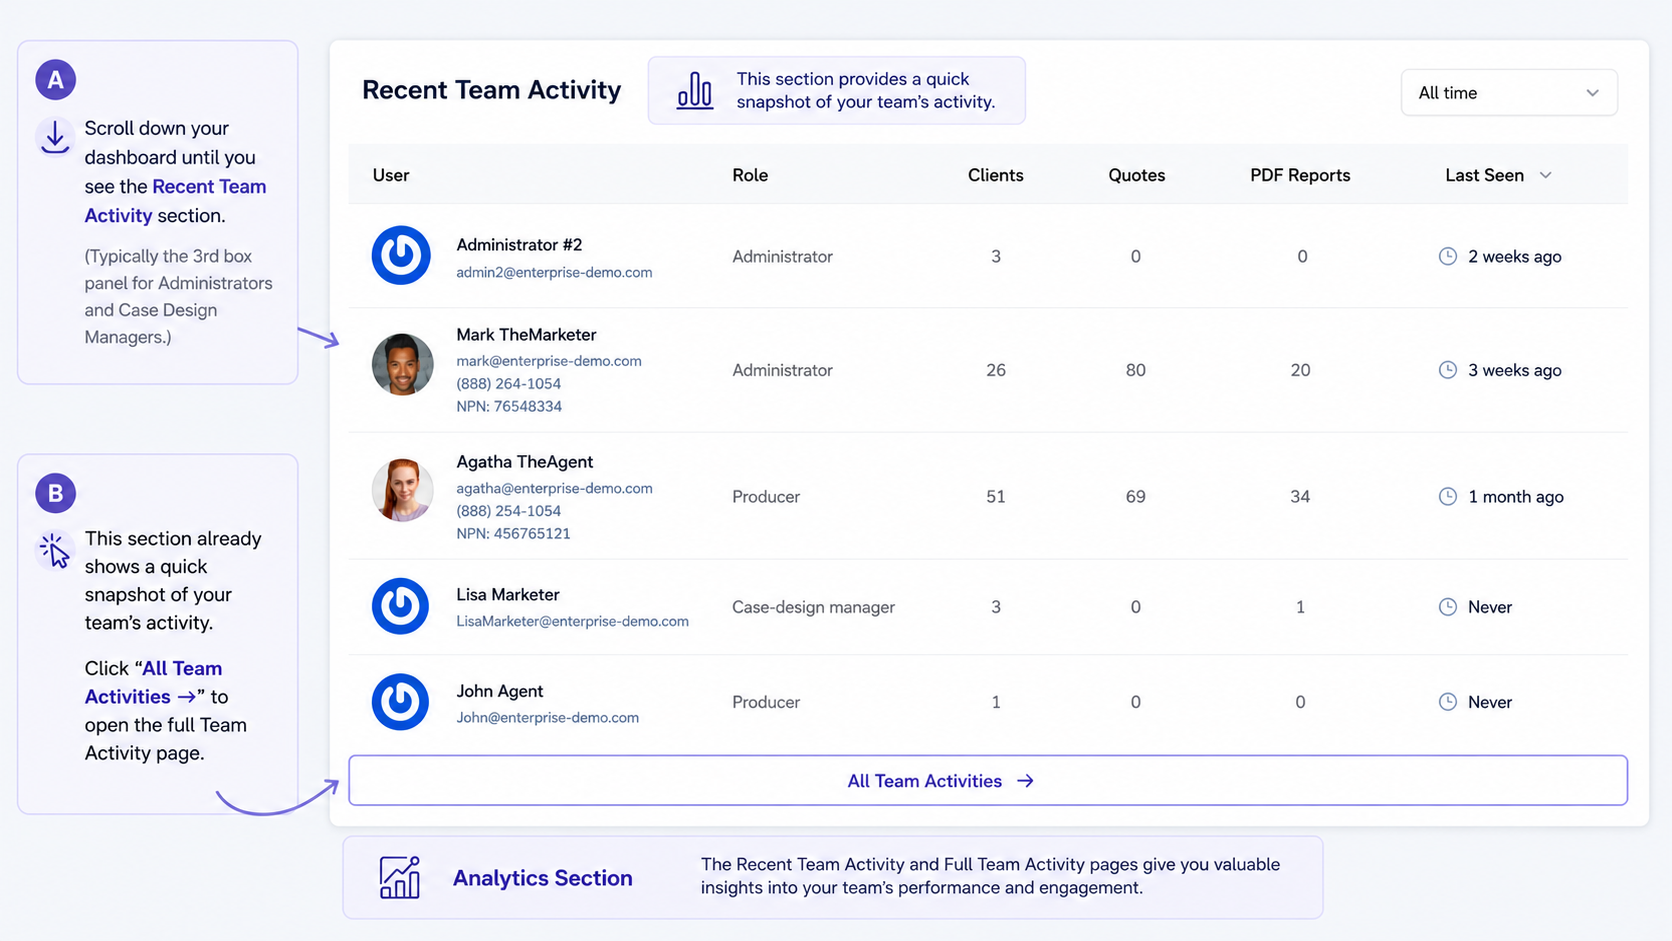
Scroll down your dashboard until you see the Recent Team Activity section (typically the 3rd box).
- This section already shows a quick snapshot of your team’s activity
- Click “All Team Activities →” to open the full Activity page
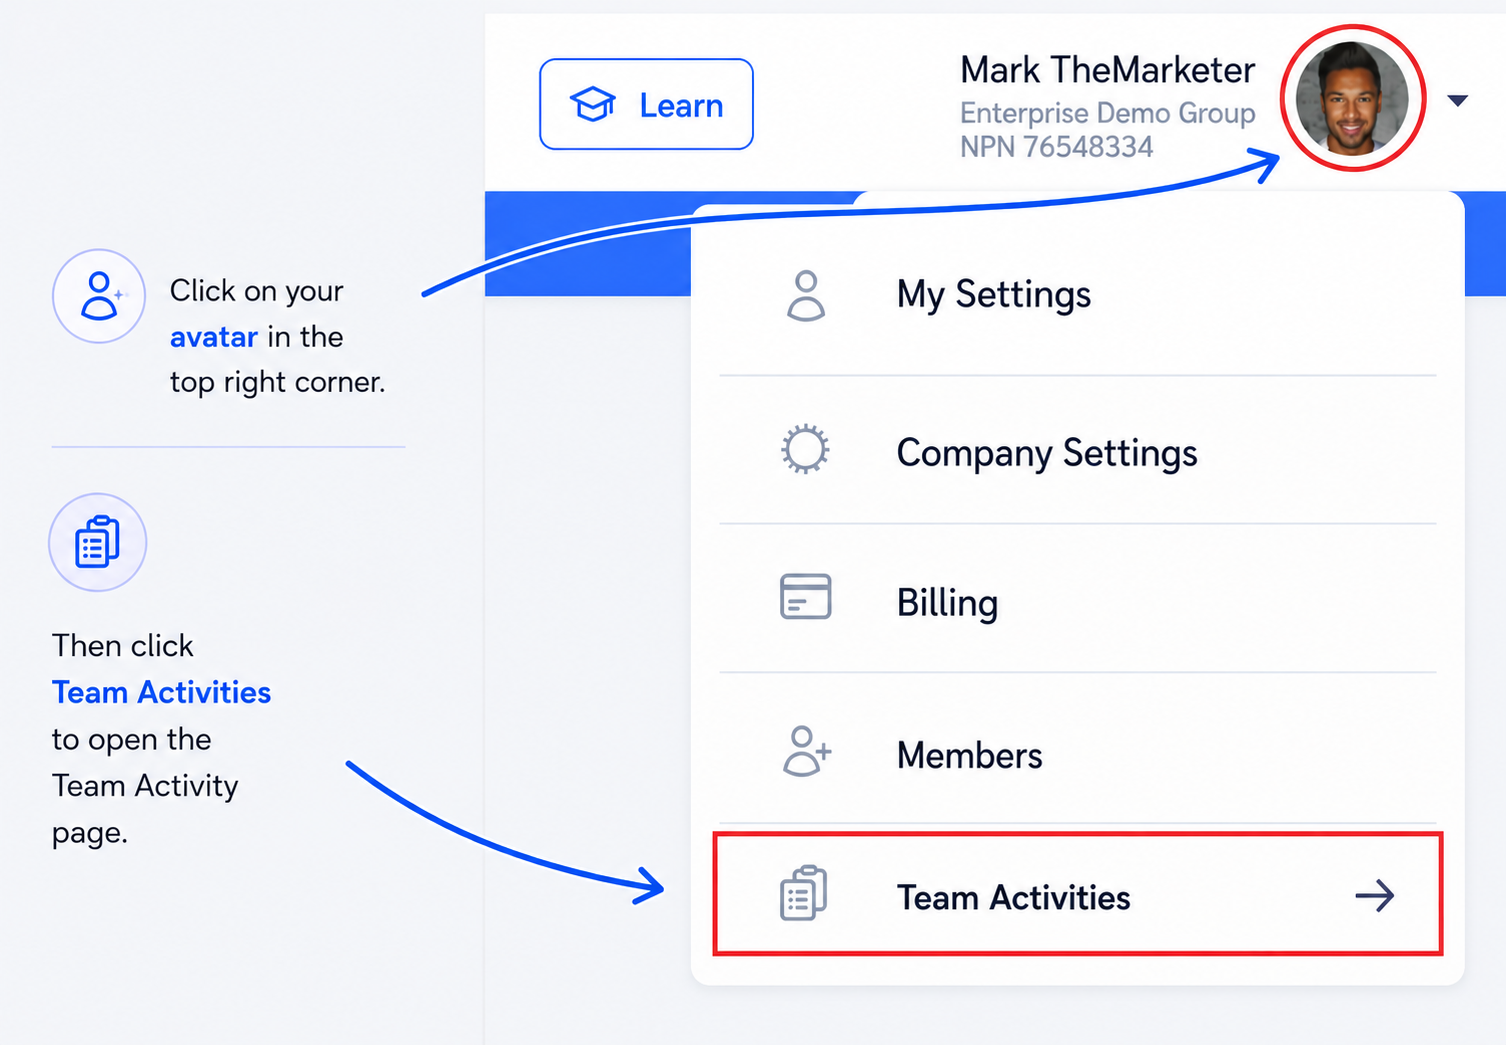
Option 2 — From your Settings
Click your profile icon in the top right corner.
- Select Team Activities from the dropdown
- This will take you to the same Activity page
Both options will take you to the same Team Activities page.
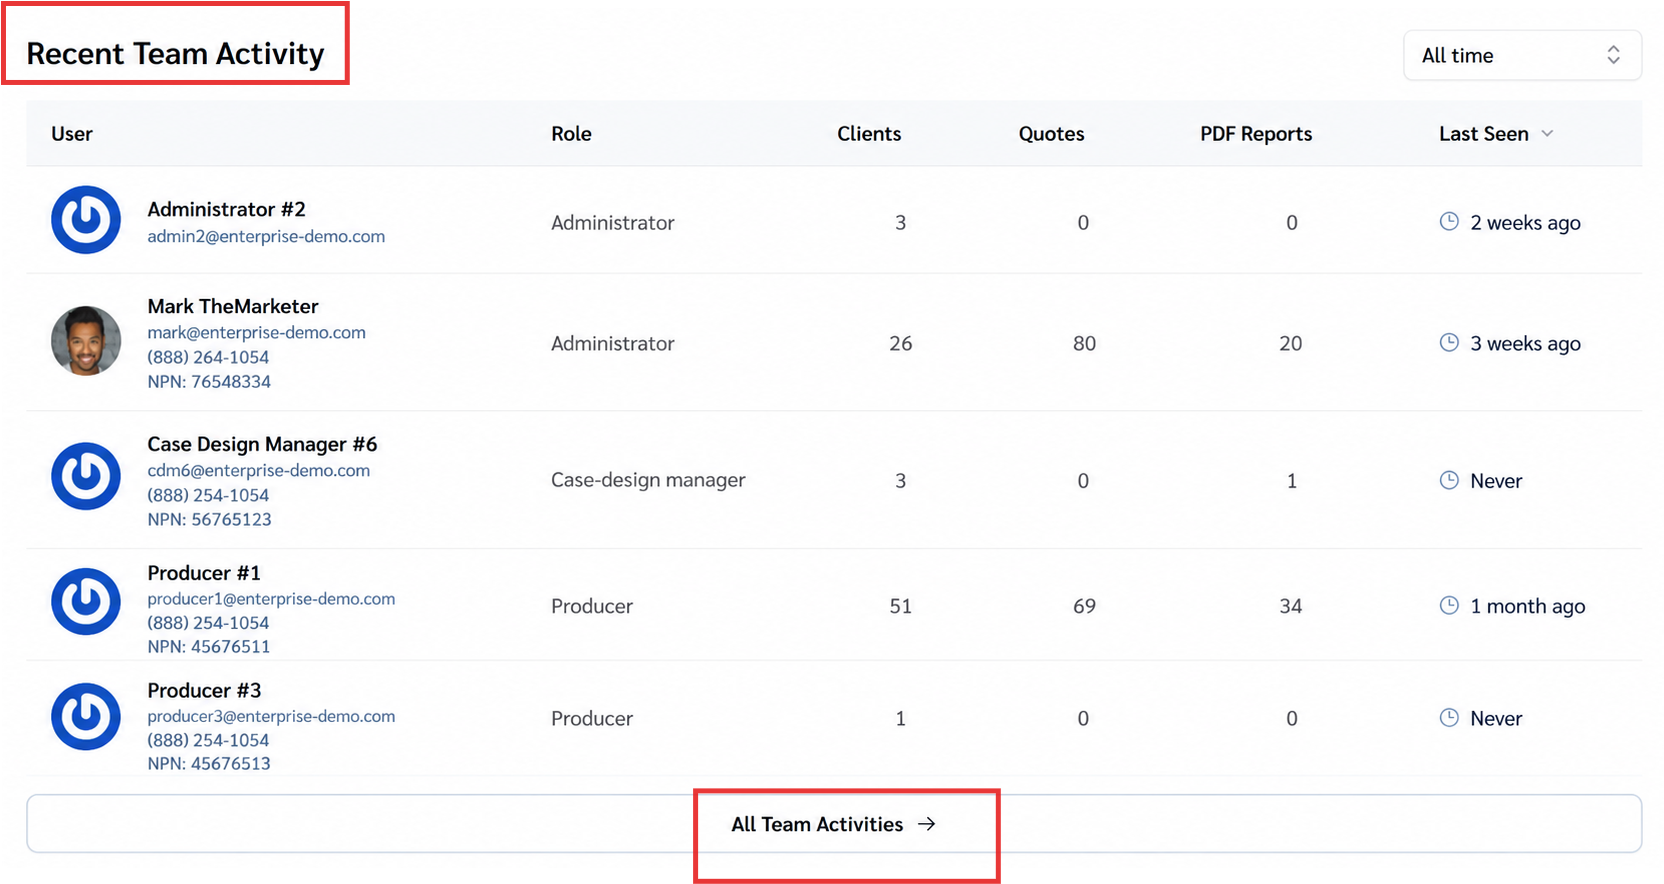
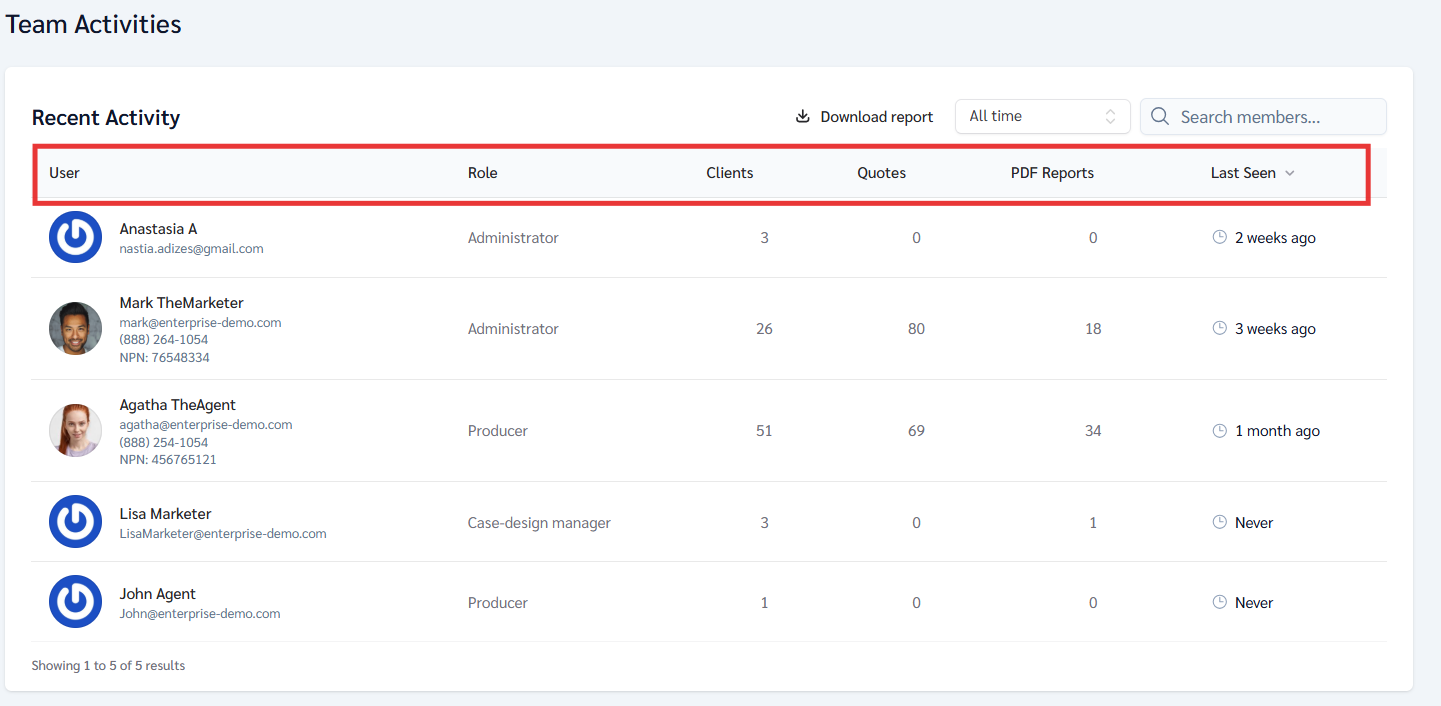
What You’ll See
On the Team Activities page, you’ll be able to quickly understand:
- Who on your team is active
- How many clients they’ve created
- How many quotes they’ve run
- How many PDF reports they’ve generated
- When they were last active
- by clicking on a specific team member you can review their client case activity and report (analytics)
Client-Level View: Recent Activity →
Team Activities Dashboard & Weekly Reports
The Team Activities Dashboard allows Administrators and Case Design Managers to monitor team activity within the platform. Recent activity is displayed on the main dashboard under Activity. To view additional team activity and analytics, select “View All Activity →.”
This dashboard panel is only available to:
- Administrators
- Case Design Managers
Producers do not have access to this dashboard panel or the weekly reports.
Administrator Access
Administrators can:
- View activity for Producers, Affiliates, and Case Design Managers
- See clients created
- See quotes generated
- See PDF reports generated
- See recent user activity
- Search team members
- Filter activity by timeframe
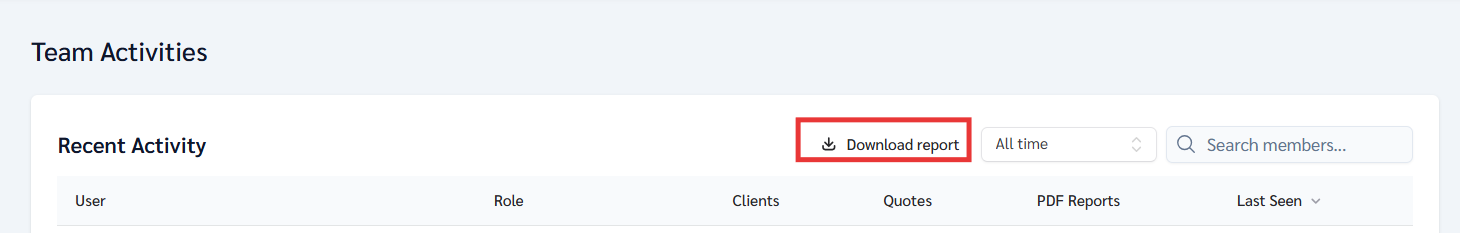
- Download reports
- Sort columns from highest to lowest or lowest to highest
- Open a user profile to view additional activity details
Example:
An Administrator can review which users are running the most cases or generating the most reports.
Case Design Manager Access
Case Design Managers can:
- View activity for assigned Producers and Affiliates
- See clients created
- See quotes generated
- See PDF reports generated
- See recent user activity
- Search assigned users
- Filter activity by timeframe
- Sort columns from highest to lowest or lowest to highest
Case Design Managers do not have full organization-wide visibility like Administrators.
Example:
A Case Design Manager can review Producer activity and monitor case workflow activity for assigned users.
Understanding Team Activities
| Section | Description |
|---|---|
| Recent Activity | Displays team activity inside the platform. |
| User | Shows the user profile and contact information. |
| Role | Displays the user’s assigned role within the organization. |
| Clients | Shows the number of clients created or managed by the user. |
| Quotes | Displays how many quotes the user has generated. |
| PDF Reports | Shows how many PDF reports were generated within the platform. |
| Last Seen | Displays the user’s most recent platform activity. |
| Search Members | Allows you to search for specific users within the dashboard. |
| Time Filter | Allows activity to be filtered by timeframe. |
| Download Report |
Exports activity and production data into a downloadable report. |
Sorting Data
Some columns can be sorted in ascending or descending order.
This allows users to:
- Compare activity
- Review production totals
- Organize data from highest to lowest or lowest to highest
Example:
You can sort the Clients column to see which users created the most clients.
Click on a specific user to open their detailed activity dashboard and view their activity analytics
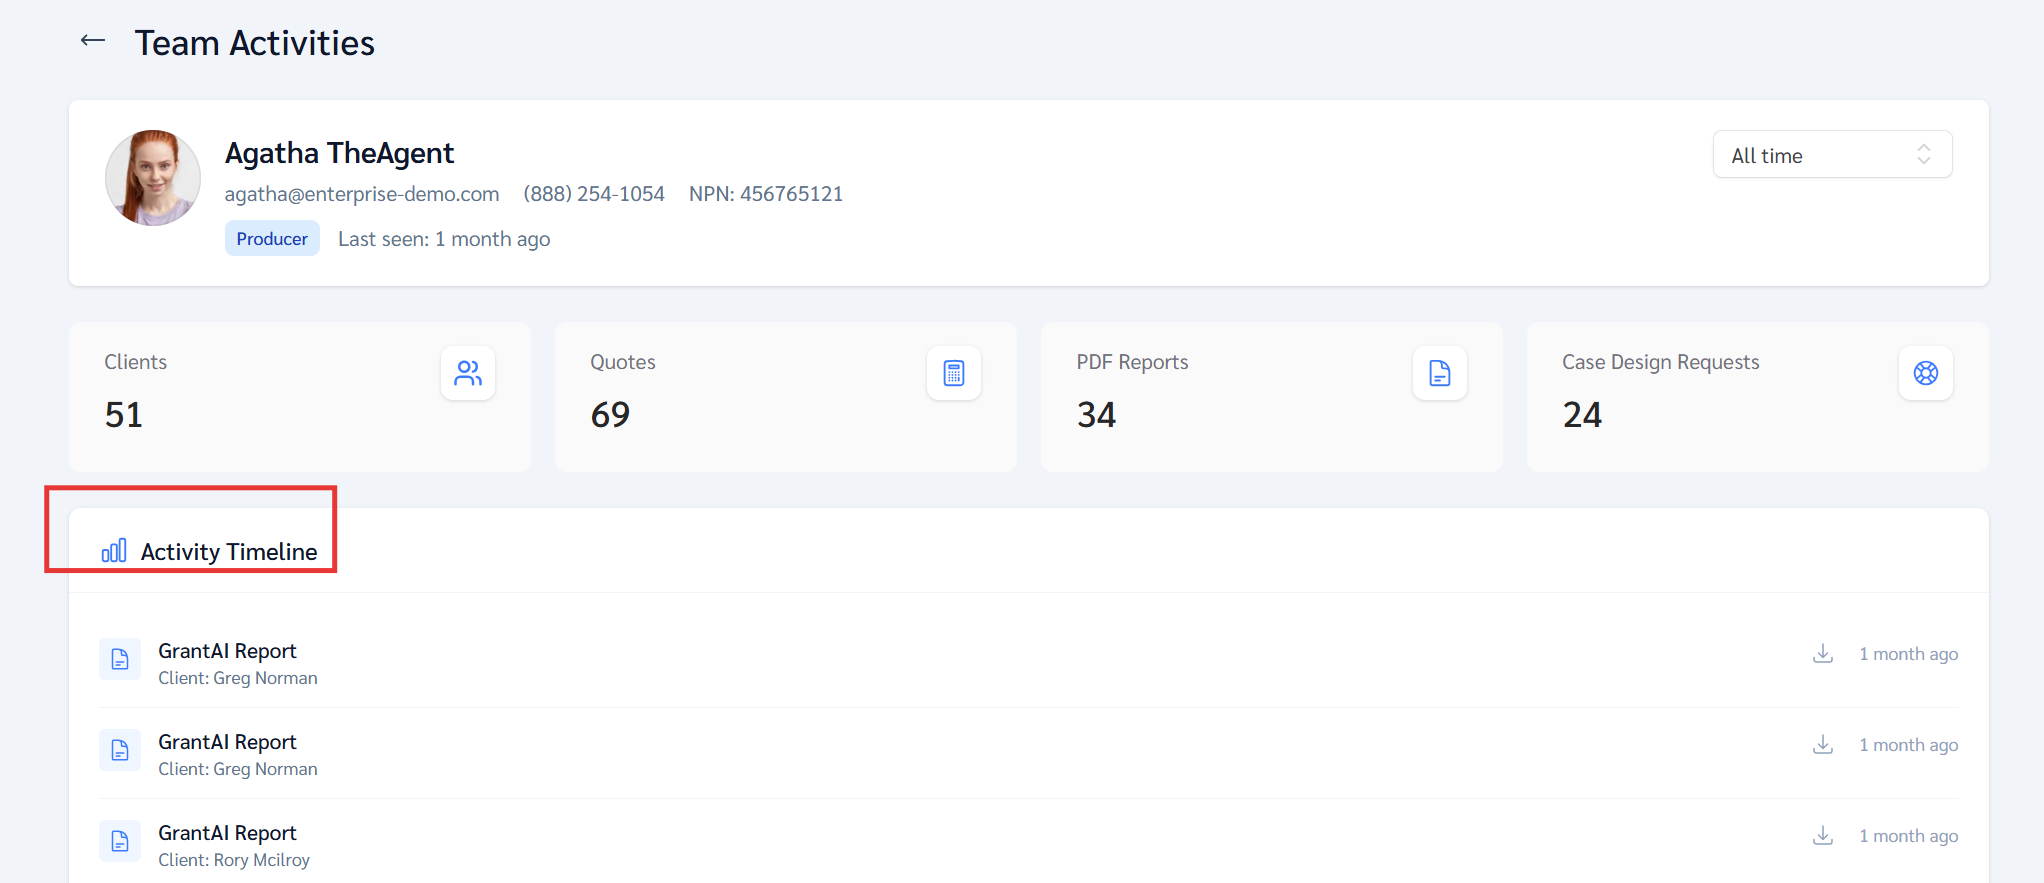
From this section, Case Design Managers and Administrators can:
- View the user’s clients
- Review quotes and PDF reports
- Monitor case design requests
- View recent platform activity and engagement
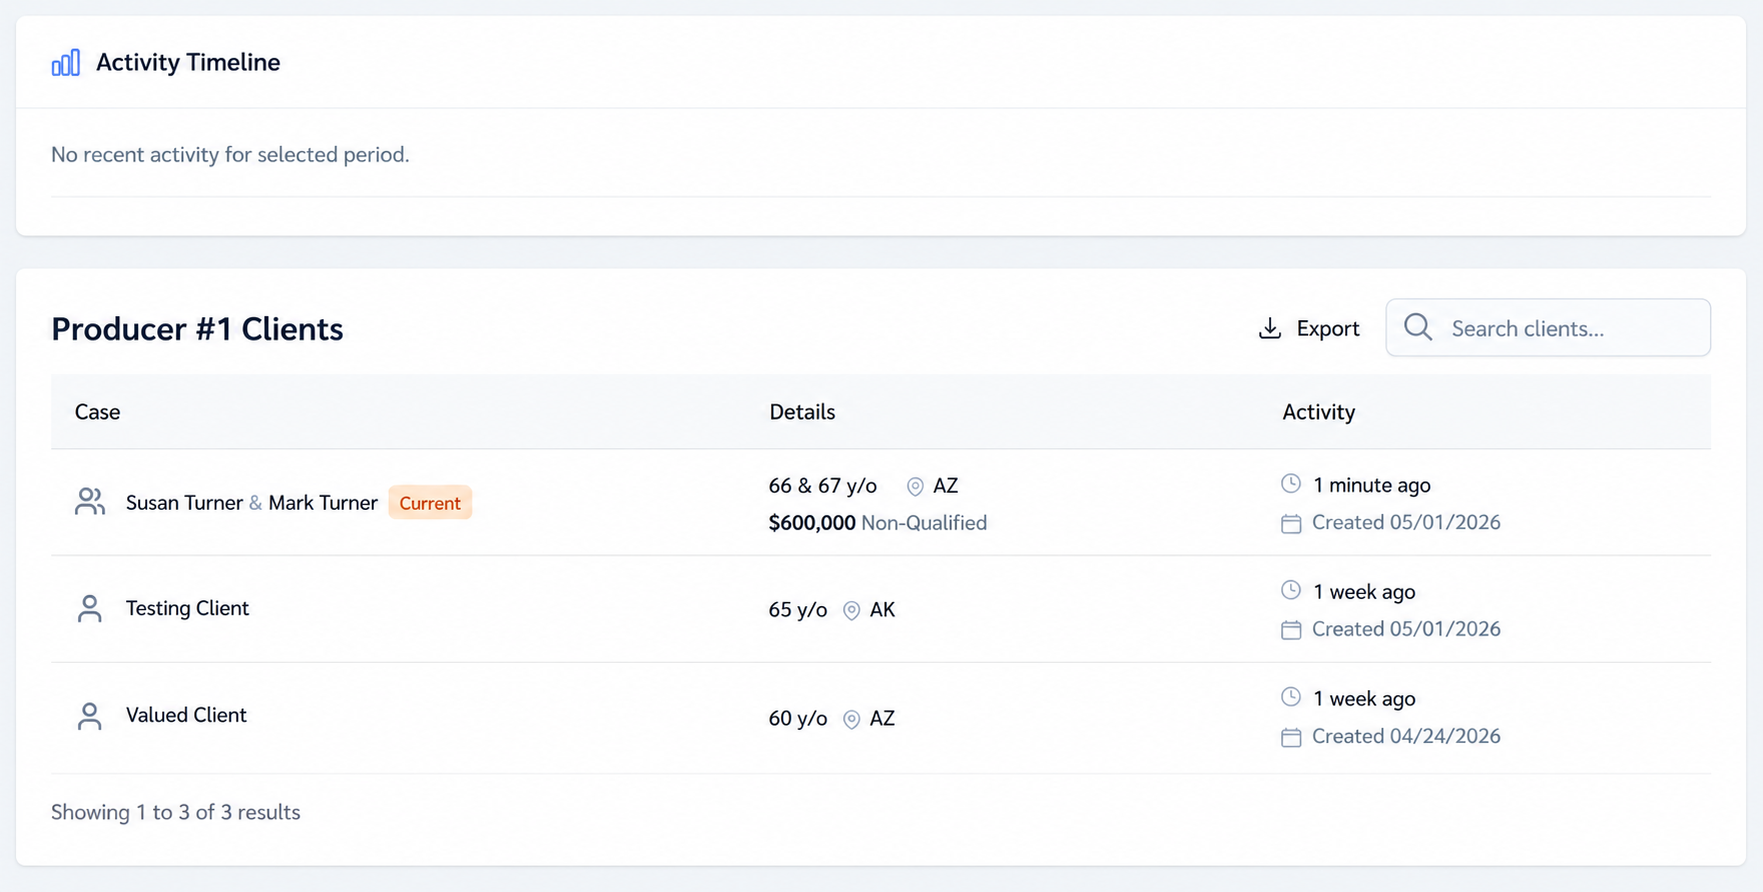
- Open individual client profiles directly from the dashboard
- Review case details, activity history, and analytics
This provides a centralized way to monitor team activity, production metrics, client workflows, and overall user engagement within the platform.
Weekly Team Activity Reports
The platform can automatically send weekly activity reports.
Administrator Reports
Administrators receive reports that may include:
- Producers
- Affiliates
- Case Design Managers
Case Design Manager Reports
Case Design Managers receive reports only for assigned Producers and Affiliates.
Weekly Report Schedule
- Reports are sent every Friday at 5:00 PM New York time
- Reports are only sent if there were active cases during the previous week
- Reports are sent from support@annuitiesgenius.com
- Reports can be disabled for teams if needed
If you have questions, please contact Customer Support through the blue chat bubble, by phone at 949-600-7707, or by email at help@annuitiesgenius.com.