
What is the Index Performance Snapshot in the Performance Analyzer?
Typically, returns in the Performance Analyzer take into account various annuity strategy characteristics such as caps, spreads, participation rates, calculation methods (e.g., annual point-to-point), and duration (e.g., 5-year). However, an advisor may wish to quickly review the underlying index itself to assess its performance, history, and other relevant details.
The Index Performance snapshot is accessible via a link within the Performance Analyzer and provides valuable insights into the indices used in these strategies. To open this tool, click on the action menu (three vertical dots) next to any strategy in the Performance Analyzer and select "Index Performance."

In the snapshot, you will find the ticker symbol of the index being employed, the date it was launched, and a link to the index provider's website. Below that, you will see an overview of the index's annualized average performance over various durations of time (year-to-date, last year, the last 3 years, the last 5 years, etc.).
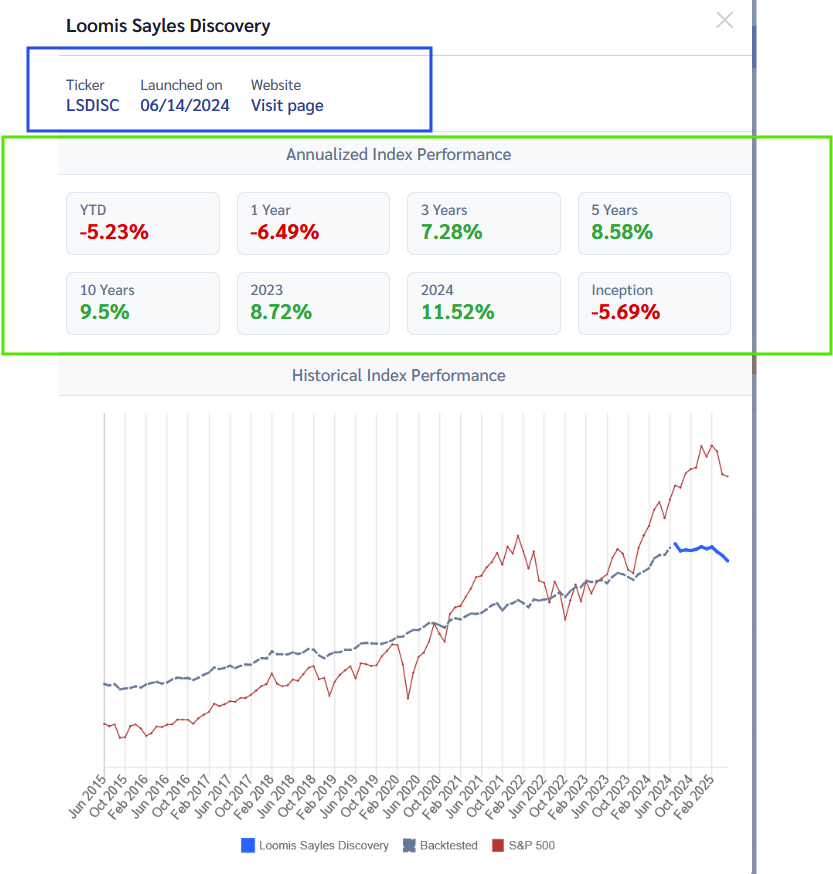
Below this, there is a chart that compares the index's performance to the S&P 500. The index's actual returns are represented by the colored portion of the diagram, while the gray dotted line in earlier years (if visible) represents backtested returns created by the index provider to show hypothetical performance in previous years.

If you want to remove some of the information in the chart (such as the index returns, backtested index returns, or S&P 500 data), simply click the data you wish to remove in the legend [or re-click to add it back].
